The June 2022 release for ArcGIS Experience Builder introduces many new features to help you easily build no-code and low-code web apps and pages. We’ve added three new widgets—Print, Timeline, and 3D Toolbox. In addition, the new Utility service panel allows you to add and manage services that enable printing, geocoding, routing, and more. Other highly anticipated improvements include resetting all filters to their original states, and customizing symbols for the Show on map action. Let’s explore the features.
With the Print widget, you can preview your map’s printed extent before you print. In the example below, the highlighted area shows the extent that would appear in the print result. The highlighted area appears when the Preview print extents box is checked. You can set the printed extent using the map’s current extent or current scale, or by providing a specific scale.

When you click Print, a dot shows on the right of the Print result tab, indicating that a new printout is available.

In the widget’s configuration settings, you can modify or delete a default print template or add a new one from the printing service you choose.
You can also choose from two modes—Classic and Compact. With the former, you can decide to make advanced options, such as Include legend, Title, Print quality, Output spatial reference, and more, available for users to customize.

Timeline
With the Timeline widget, you can see how data changes over time on a map, list, and more. Use cases include hurricanes, population migrations, environment change, and wildfire or flood event progression.The widget requires temporal and time-enabled data and works with or without the map.

In addition to settings like start time, end time, time step, you can configure the time animation to play automatically when the widget loads.
3D Toolbox
The 3D Toolbox widget adds 3D effects and analysis tools to web scenes. Currently, the widget supports daylight, weather, shadow cast, and line of sight tools. You can choose which tools to include and further configure them.
Line of sight determines sight lines from an observer point and target points as shown below. Green lines indicates what the observer can see, while red lines indicate where sight lines are obstructed. Unlike the rest of the tools, Line of sight does not provide any settings.

Daylight illuminates the scene with simulated real-world sunlight and shadows.

Weather adds atmospheric effects for Sunny, Cloudy, Rainy, Snowy, or Foggy weather.

Shadow cast displays the cumulative shadows of 3D features based on sunlight for a given date and time. Useful in fields such as architecture or urban planning, the tool provides three visualization modes—Areas above threshold, Total shadow duration, and Discrete shadows.

Noted that terrain does not cast shadows, and therefore is not taken into account by the tool.
Utility Service
The new Utility service panel allows you to add services that enable printing, geocoding, routing, geoenrichment, and geometry. You can add utilities by entering service URLs or selecting items. Like the Data panel, these services are shared and managed at the app level, and therefore can be used by any applicable widgets.

Major Enhancements
Filter
Many of you have been asking for the ability to reset filters to their original states. This now has been added to the filtering capability. You can use it with the Filter widget as shown below, or with widgets that include a filter tool, such as List.


Map
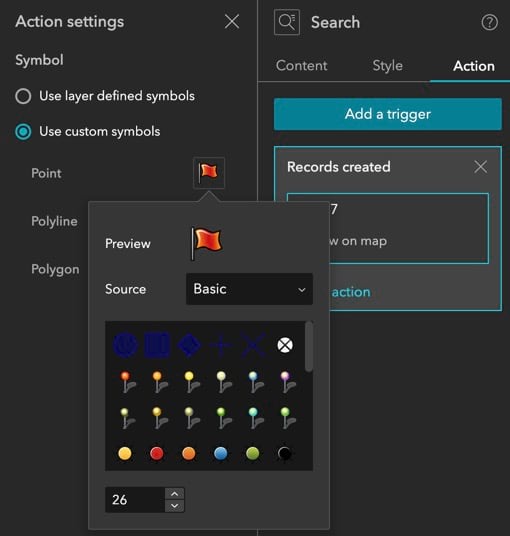
When you try to find a place on the map and make the Search widget announce the Record created message, the Map widget listens to it and responses with the Show on map action. You can now customize the symbol for the Show on map action. You can choose the symbol’s style, color, and size so it displays nicely on the map.
Map Layers
You can now choose whether to show or hide labels for each applicable layer. If a layer is an item, clicking Details opens the layer’s item page.
Search
In addition to a page, you can now set a link for search results to open a specific window or view, and even scroll to a block or the top of the current scrolling page.

For locator sources, you can now choose one or more fields to display in the search result panel.

Chart
To highlight interesting values, you can add an auxiliary guide to the chart. You can also choose the alignment of the value label position for bar and column charts. The example below shows an auxiliary line with $30,000 income and the value label aligned in the middle of each bar.

Here is how you configure them.

Additionally, you can calculate statistics by median.

Survey
By default, the Survey widget no longer automatically refreshes after users submit responses, meaning you can display a thank you or more information screen. If you want to configure auto-refresh to allow users to submit multiple responses, go to the Survey123 website to turn it on.
Directions
You now can save a route as a Route Layer item in My content.

Floor Filter
The Floor Filter widget is now out of beta.
Business Analyst Infographic(beta)
More options are available in the Business Analyst Infographic (beta) widget such as printing , exporting to HTML and Excel in addition to Image, viewing the infographic in a fullscreen mode, and disabling page zoom. Additionally, the new Update infographic button allows you to apply any and all changes at once in the widget’s settings.

Subscriber Content
When you publish a web experience or template that you own, if you added subscriber content as a utility service (like routing below), you’ll be prompted to authorize public access via your account.

Templates
New templates include five page templates—Route, Gear, Showcase, Events, Sketchbook—and one window template—Steps.
In addition, on the Insert widget panel, widgets such as Branch Version Management and Utility Network Trace now have an icon and ToolTips to indicate that they require additional subscriptions.
For more information, see What’s new in Experience Builder.Please reach out to experiencebuilder@esri.com with questions.
Thank you,
The ArcGIS Experience Builder Team
Subscribe to our newsletter to receive the latest ArcGIS Experience Builder updates, news, and content.


Article Discussion: